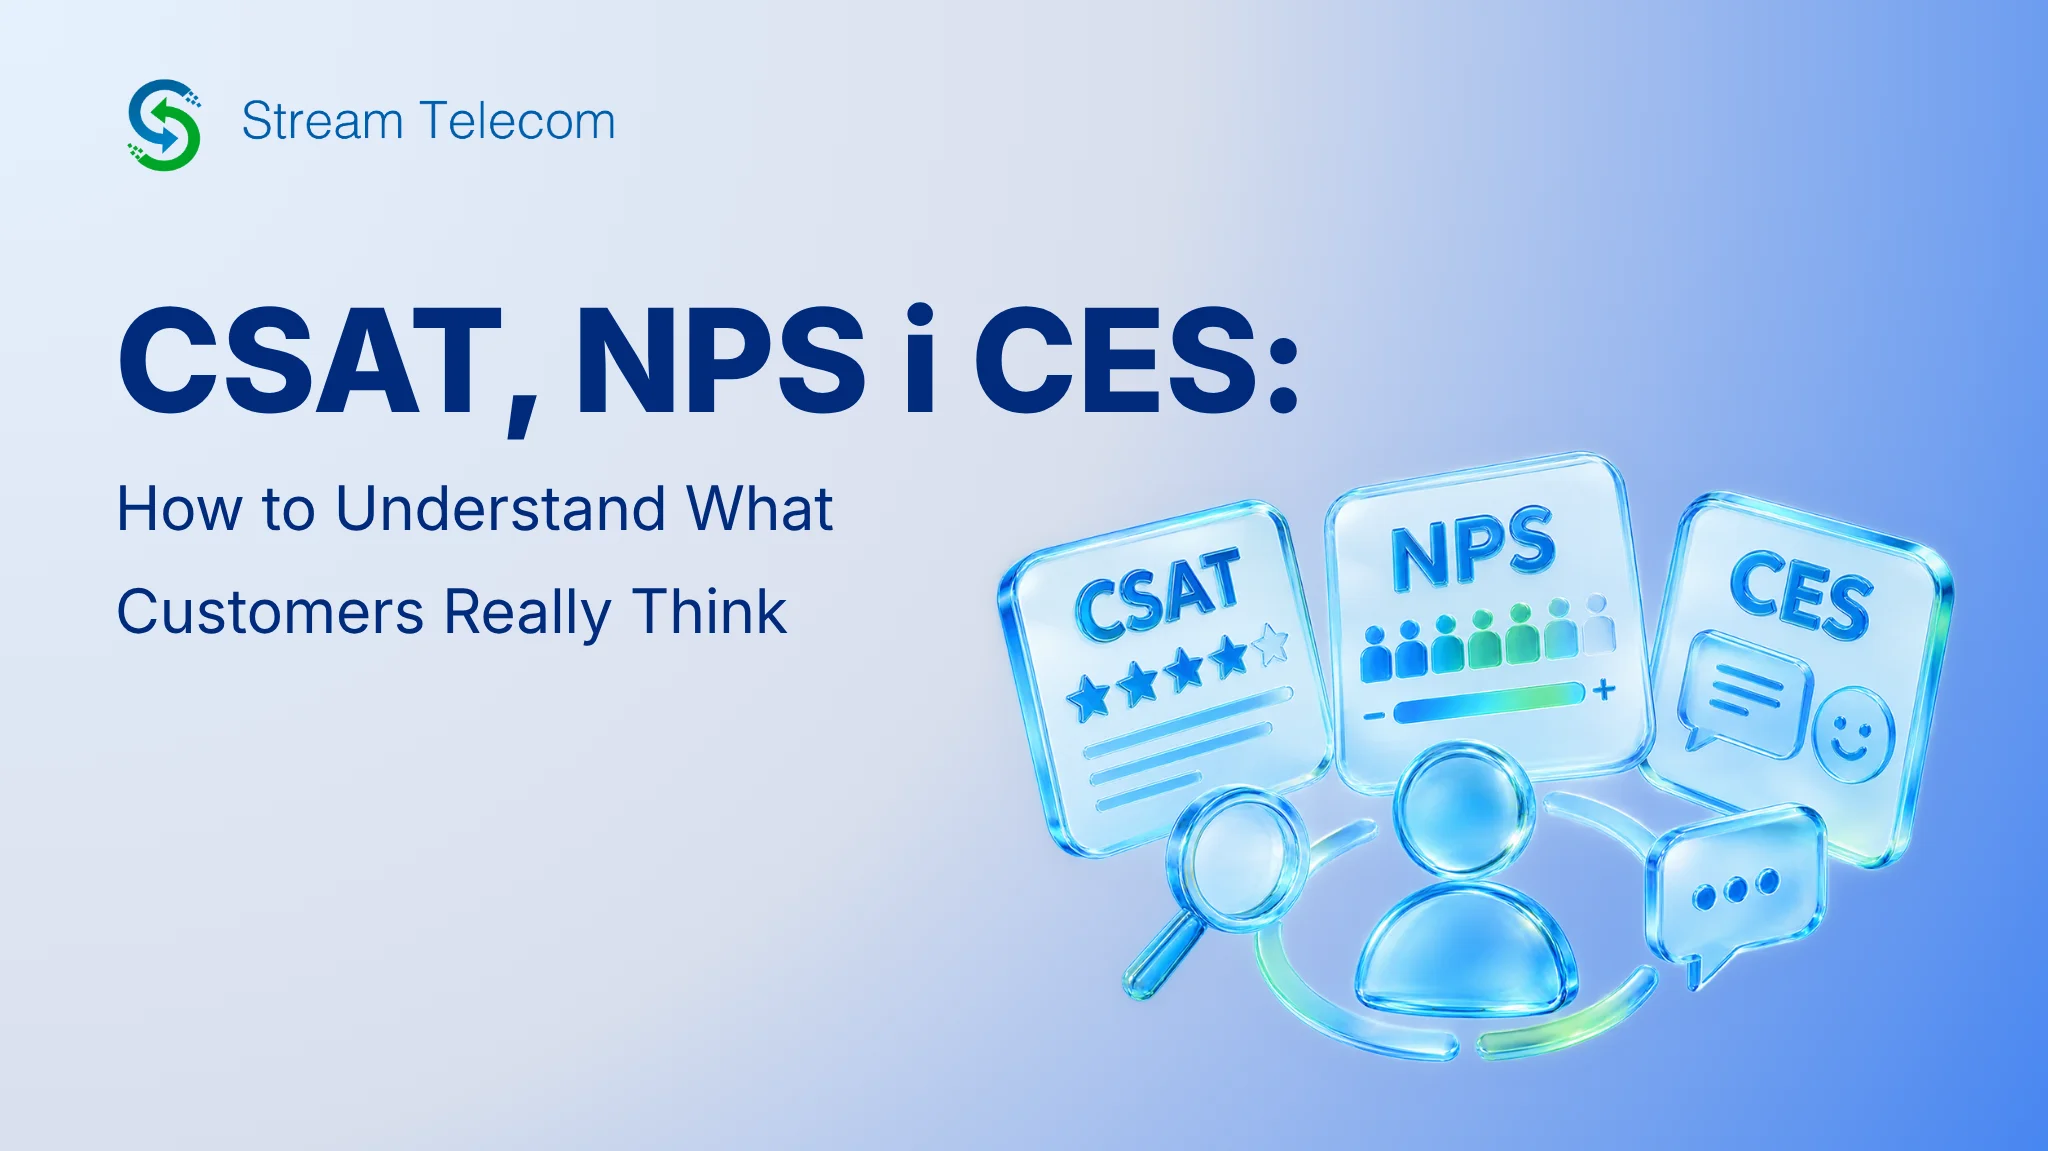
CSAT, NPS, and CES: How to Understand What Customers Really Think
Customers don’t always tell you what they didn’t like about your service, product, or purchase process. Often they do something simpler — they just don’t come back. According to PwC, 32% of consumers are willing to stop engaging with a brand they like after just one bad experience.
For a business, this means the problem may be noticed too late: when repeat purchases decline, churn rises, or customers start moving to competitors. Meanwhile, the actual reason for their dissatisfaction remains unknown.
To avoid guessing, companies rely on three core customer experience metrics — CSAT, NPS, and CES. They help determine whether a customer is satisfied with the service, whether they’re willing to recommend the company, and how easily they were able to resolve their issue.
In this article, we’ll break down how these indicators differ, how to calculate them correctly, and when to run surveys. We’ll also show how to automate response collection with ServicePulse from Stream Telecom.
CSAT, NPS, and CES: What’s the Difference
At first glance, all three metrics seem to measure roughly the same thing — the customer’s attitude toward the company. In reality, each one answers a different question.
Consider a simple example. A customer contacted support and received a reply. CSAT can be used to assess whether they’re satisfied with the service, while CES shows how easily they were able to resolve their issue. NPS is better used later, to find out how the customer feels about the company overall and whether they’re willing to recommend it.
| Metric | What It Measures | Core Question | When to Survey |
|---|---|---|---|
| CSAT | Satisfaction | “How satisfied are you with the service?” | After a purchase, consultation, delivery, or support request |
| NPS | Loyalty | “How likely are you to recommend our company?” | After the customer has formed an overall impression of the company |
| CES | Ease of interaction | “How easy was it to resolve your issue?” | Immediately after a specific action or request is completed |
CSAT: Is the Customer Satisfied with a Specific Interaction
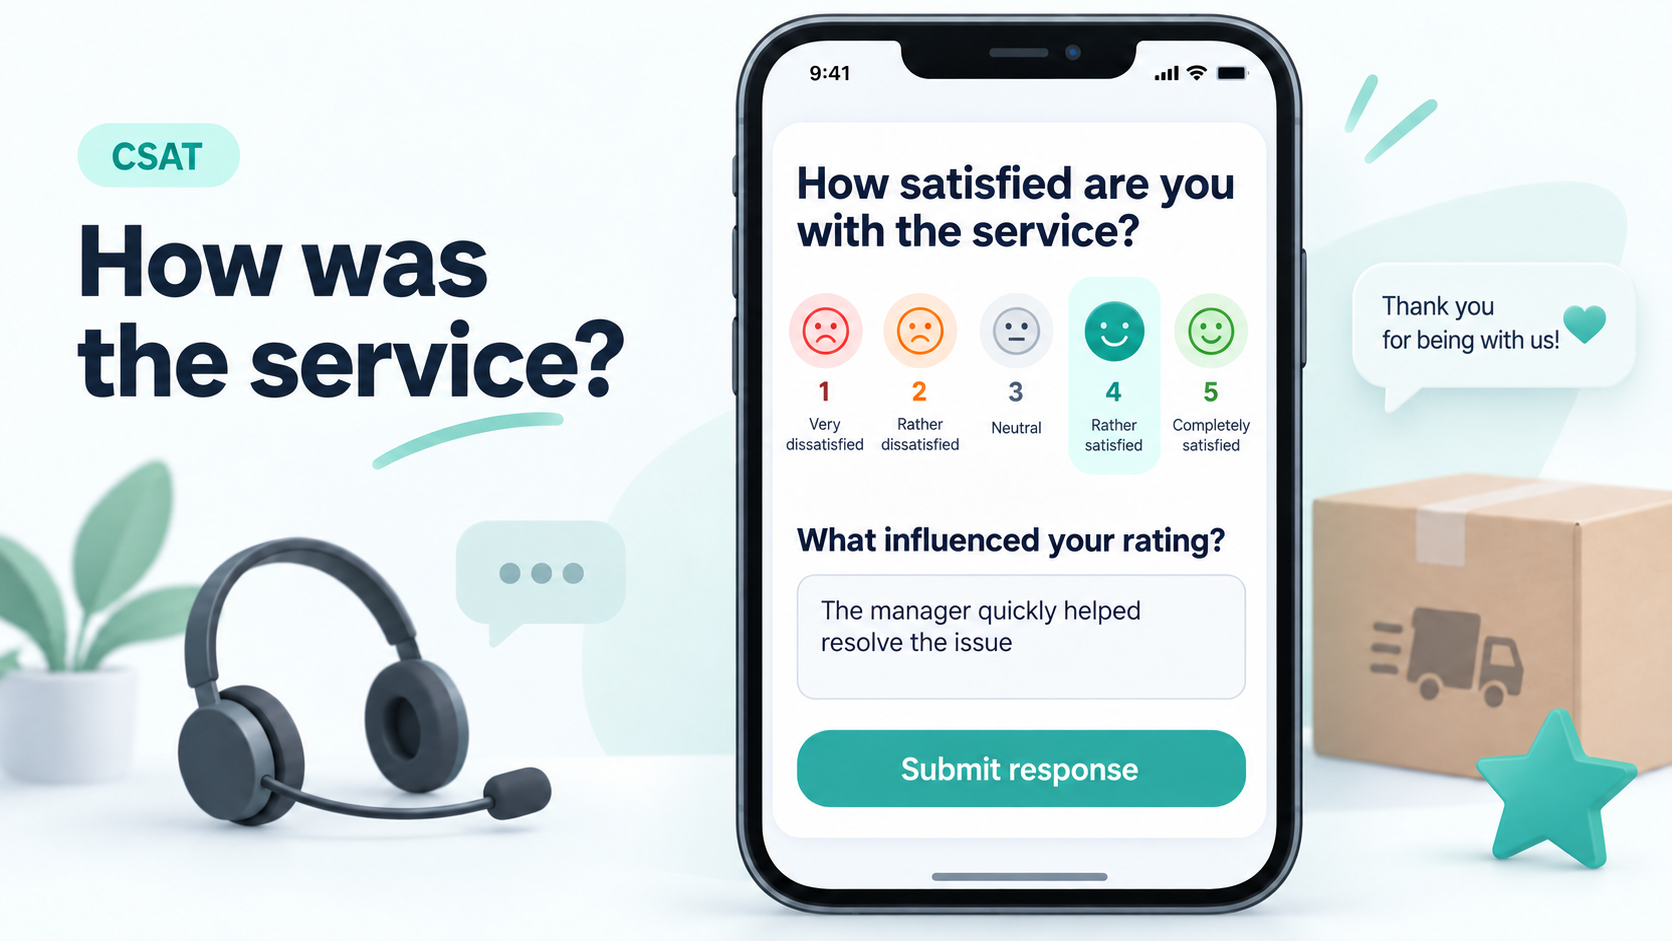
CSAT, or Customer Satisfaction Score, shows how satisfied a customer is with a particular experience: a manager’s consultation, order processing, delivery, support performance, or the service received.
Customers are typically asked one simple question:
“How satisfied are you with the service?”
The response is usually given on a five-point scale:
- 1 — not at all satisfied;
- 2 — somewhat dissatisfied;
- 3 — neutral;
- 4 — somewhat satisfied;
- 5 — fully satisfied.
The wording can be adjusted depending on exactly what needs to be assessed. For example:
- “How satisfied are you with the manager’s consultation?”;
- “How would you rate the delivery quality?”;
- “How was your order placement experience?”.
How CSAT Is Calculated
CSAT shows the share of positive responses. On a five-point scale, ratings of 4 and 5 are usually counted as positive.
CSAT = number of positive responses ÷ total number of responses × 100%
There’s no need to calculate the result manually. ServicePulse collects responses and automatically calculates the metric, which can be viewed in the survey statistics.
There’s no single value considered “good” across every business. Results depend on the industry, the type of service, and the timing of the survey. So it’s more useful to track changes in your own CSAT over time — comparing results across periods, departments, or individual stages of the customer journey.
When to Run a CSAT Survey
The question should be asked shortly after the interaction, while the customer still remembers the experience well. For example:
- right after a conversation with an agent ends;
- after an order is received;
- after using a new product feature.
It’s useful to add an open-ended question to the rating: “What influenced your answer?” The score itself shows the satisfaction level, while the comment helps explain the reason behind it. Customer responses often reveal specific issues: long wait times, unclear instructions, a complicated checkout process, or insufficient attention from a manager.
NPS: Is the Customer Willing to Recommend the Company
NPS, or Net Promoter Score, helps assess customer loyalty through their willingness to recommend the company. Unlike CSAT, this metric doesn’t evaluate a single purchase or conversation with a manager — it reflects the overall impression of interacting with the business.
The customer is asked:
“How likely are you to recommend our company to friends or colleagues?”
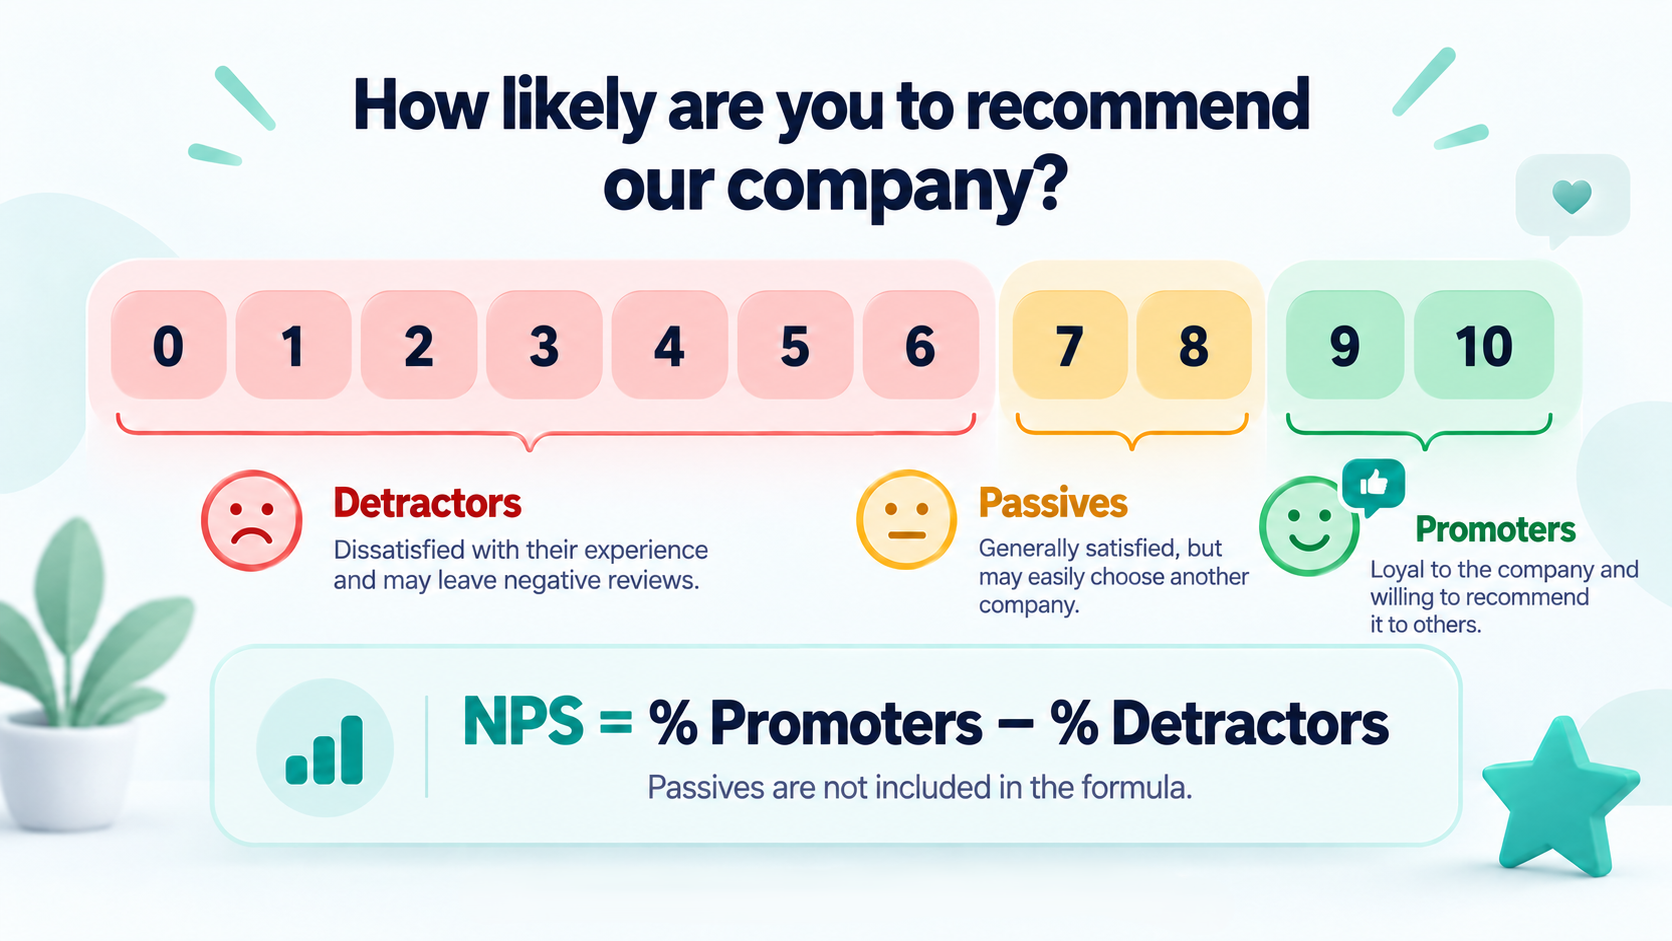
The response is given on a scale from 0 to 10. Based on the score, customers fall into three groups:
- promoters — 9–10 points. Loyal customers willing to recommend the company;
- passives — 7–8 points. Generally satisfied, but may switch to a competitor;
- detractors — 0–6 points. Customers who had a negative experience or didn’t get the expected result.
How NPS Is Calculated
To calculate NPS, the share of detractors is subtracted from the share of promoters. Passives aren’t part of the formula, but they are included in the total number of responses.
NPS = % promoters − % detractors
In ServicePulse, responses are automatically sorted into groups, and the system calculates the final score. The result can range from −100 to +100:
- a positive value means there are more promoters than detractors;
- zero means the shares are equal;
- a negative value means detractors outnumber promoters.
The number alone isn’t enough to understand the reasons behind customer sentiment. NPS is best analyzed alongside comments, and broken down by product, time period, or audience segment. This makes it possible to see which changes are driving loyalty up, and where the company is starting to lose supporters.
When to Run an NPS Survey
Ask about willingness to recommend once the customer has had time to form an overall impression. For example:
- after several purchases or orders;
- some time after signing up for a service;
- after completing an important stage of the relationship;
- on a regular basis — quarterly or semi-annually.
It’s worth adding a follow-up to the main question: “What influenced your score the most?” The answers help explain why some customers recommend the company while others stay neutral or become detractors.
CES: How Easy It Is for Customers to Interact with the Company
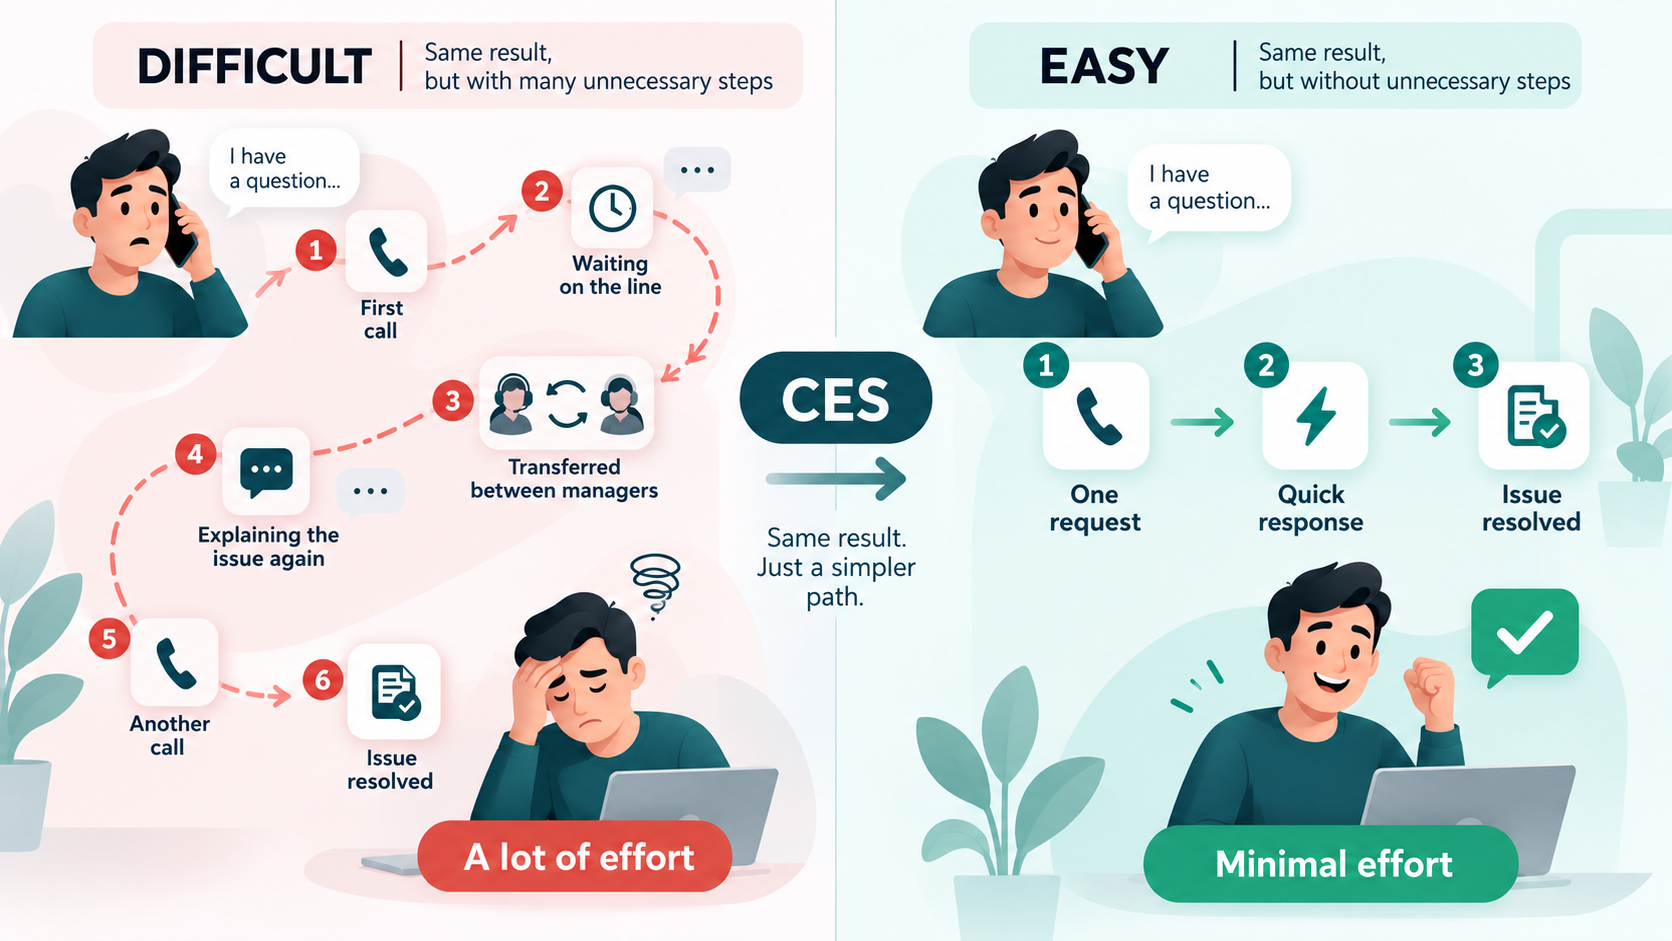
A customer can get the result they needed and still be unhappy with the process itself. For example, if resolving an issue required multiple calls, repeating the same information to different agents, or spending a long time searching for the right form on the website.
CES, or Customer Effort Score, is designed to surface these kinds of friction points. The metric shows how much effort a customer had to put in to complete a specific task.
The clearest version of the question is:
“How easy was it to resolve your issue?”
Responses can be collected on a five-point scale:
- 1 — very difficult;
- 2 — difficult;
- 3 — neither difficult nor easy;
- 4 — easy;
- 5 — very easy.
The question can also be phrased as a statement: “The company made it easy for me to resolve my issue” — and the customer is asked to rate how much they agree. The key is to use the same wording and scale across all surveys so results remain comparable.
How CES Is Calculated
CES is most commonly calculated as the average of all responses:
CES = sum of scores received ÷ number of responses
The higher the result, the easier it is for customers to interact with the company. In ServicePulse, the metric is calculated automatically, so the result is immediately visible in the survey statistics.
CES should be analyzed separately for each process. A low score after a support request may point to long wait times or too many transfers between agents, while a low score after a purchase may point to a complicated checkout form or confusing payment step. This way, the metric reflects specific obstacles in the customer’s path rather than a general attitude toward the brand.
When to Run a CES Survey
Ask the question immediately after the action being evaluated is completed. For example:
- after placing or paying for an order;
- after contacting customer support;
- after a return or exchange;
- after registering on the website;
- after independently searching for information or using an online service.
It’s useful to add a follow-up: “What made the interaction more difficult?” The answers help identify unnecessary steps, unclear instructions, and other barriers that cost customers extra time and effort.
How to Design a Survey Customers Will Actually Finish
Even the right metric won’t be useful if the survey is long, confusing, or arrives at the wrong time. Customers shouldn’t have to spend several minutes figuring out what’s actually being asked.
To get more meaningful responses, follow a few rules:
- Set a single goal. Don’t try to evaluate delivery, manager performance, website usability, product quality, and brand loyalty all at once.
- Keep the survey short. Measuring CSAT, NPS, or CES usually only requires one main rating question plus one optional comment field.
- Clarify exactly what’s being rated. Instead of a general “How was our service?”, ask about the last consultation, the order process, or the resolution of a specific request.
- Don’t lead the response. Phrasing like “How much did you enjoy our amazing service?” influences the respondent’s choice and skews the result.
- Leave room to explain the rating. A customer’s comment helps clarify what worked well or what caused dissatisfaction.
- Choose the right moment. An agent’s performance can be rated right after the conversation, while impressions of a product can only be gathered after the customer has actually used it.
- Make sure it works well on mobile. The question, rating scale, and buttons need to display correctly on a small screen.
- Take the survey yourself before launching it. This helps catch confusing wording, unnecessary questions, or technical issues.
Avoid sending a survey after every minor action. If requests come too often, customers stop responding to them. It’s better to identify the key moments in the customer journey where a response will genuinely help improve a process or inform a decision.
You Got the Score — Now What
Start by breaking down responses along the dimensions that matter to your business:
- Compare individual touchpoints. Overall CSAT can be high even when customers are unhappy specifically with delivery or one particular support channel.
- Review results by customer segment. New vs. returning customers, users of different products, or customers in different regions may rate the company differently.
- Read comments alongside scores. A low score flags the problem; the customer’s explanation helps identify the cause.
- Look for recurring complaints. A single negative response may be an isolated case. If dozens of customers mention long wait times, complicated payment, or unclear terms, that’s a systemic issue.
- Turn findings into action items. Define what needs to change, who’s responsible for it, and when the team will evaluate the result.
If the survey isn’t anonymous, you can reach out to a dissatisfied customer, clarify the details, and offer a solution. It’s important not to try to talk the person into changing their score, but to show them that the company heard them and is ready to fix the issue.
After making changes, run the same survey again. This lets you check whether the new instructions, a shorter checkout form, or a different support process actually improved the customer experience.
In the end, these metrics become a working cycle: get a score — find the cause — make a change — check the result again.
How to Automate Surveys with ServicePulse
Once response volume grows, copying scores into a spreadsheet and manually calculating CSAT, NPS, or CES becomes impractical — and a single error can throw off the final result.
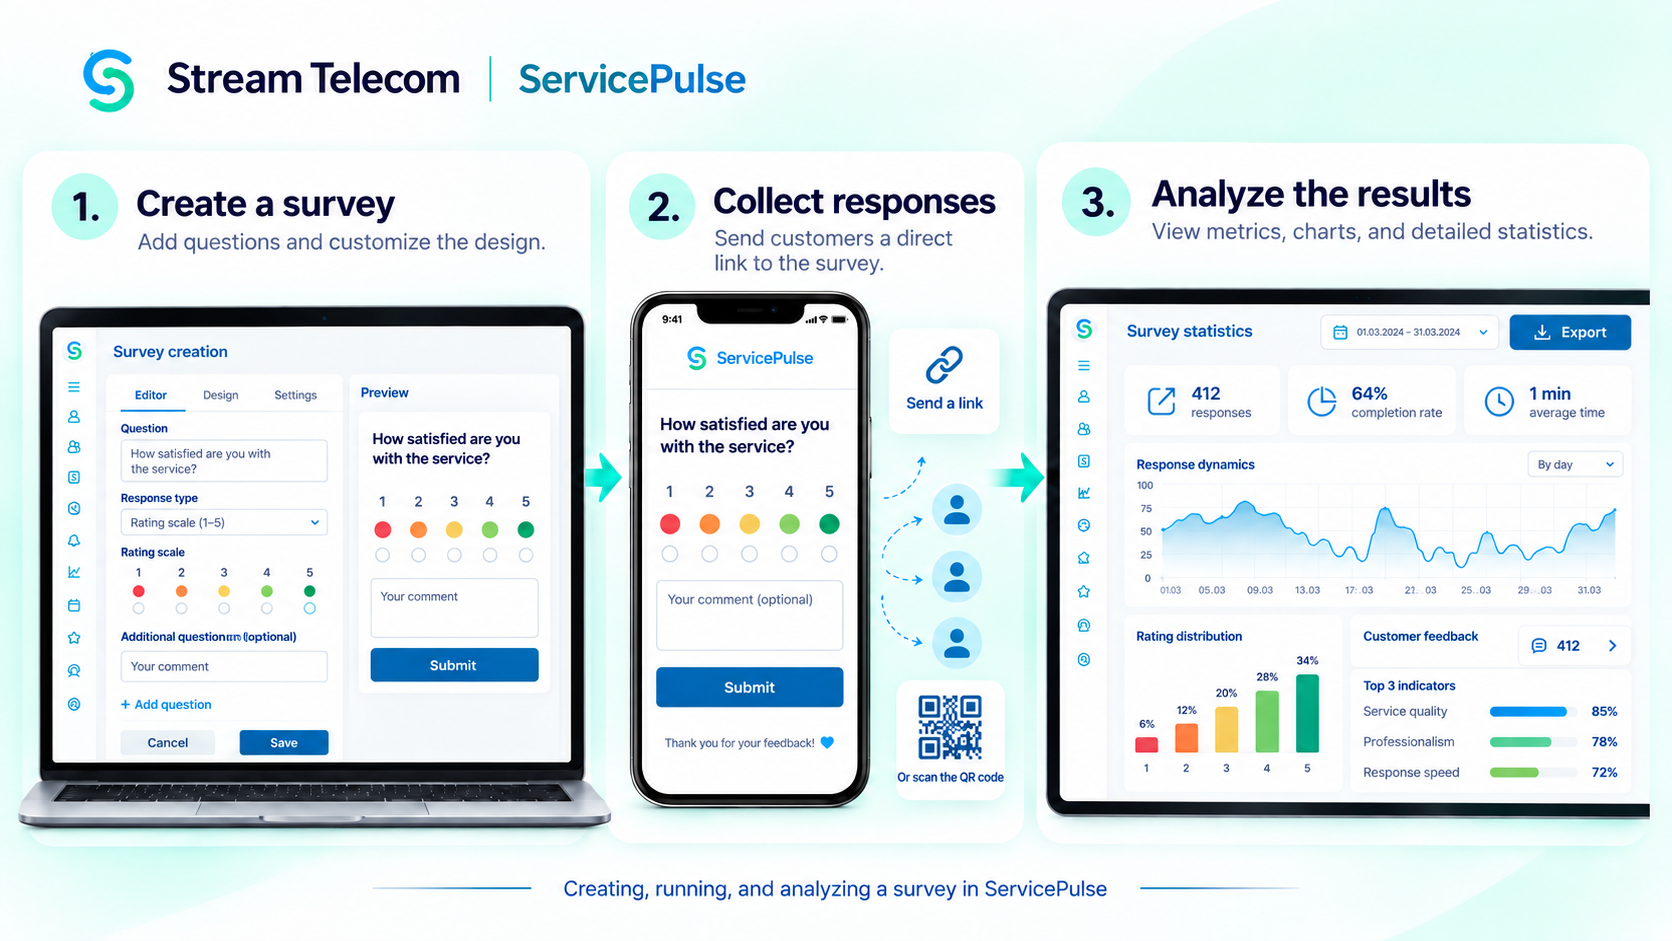
ServicePulse from Stream Telecom brings survey creation, response collection, and results analysis together in one system. Working with a survey involves three stages:
- Building the survey. You create the survey yourself: add a rating scale, a question with answer options, and fields for open comments. The survey can be styled to match your brand and checked in a built-in preview.
- Collecting responses. The finished survey can be shared via a direct link. Customers can complete it from a smartphone, tablet, or computer. You decide the format — ask respondents for their contact details in case follow-up is needed, or allow anonymous responses.
- Analyzing results. ServicePulse automatically calculates the metrics and generates both summary and detailed statistics. Data is displayed as charts and graphs, and filters let you compare specific response groups. Respondent reports and result exports are also available.
This means the team doesn’t need to move scores between different tools, calculate metrics manually, or build charts by hand. Results can be reviewed in one workspace and used to evaluate service quality, identify problem areas, and plan improvements.
Try ServicePulse from the Respondent’s Side
The best way to evaluate a survey is to take it yourself. We’ve put together a test survey so you can see what the questions, rating scales, and response fields look like from the respondent’s screen.
Take the survey and see how ServicePulse works in practice.
Button: “Take the Test Survey”
Don’t Guess — Ask
Customers don’t always report a bad experience. That’s exactly why regular surveys help catch a problem before it affects repeat purchases, recommendations, and overall attitude toward the company.
At the same time, collecting scores just for the sake of a report isn’t enough. The real value comes when the team analyzes the responses, identifies the causes of dissatisfaction, makes changes, and checks the results.
ServicePulse from Stream Telecom helps you build surveys, automate CSAT, NPS, and CES calculations, and bring your results together in one workspace. Submit a request to get connected and launch your first survey to find out what your customers really think.
Don’t Guess — Ask
Customers don’t always report a bad experience. That’s exactly why regular surveys help catch a problem before it affects repeat purchases, recommendations, and overall attitude toward the company.
At the same time, collecting scores just for the sake of a report isn’t enough. The real value comes when the team analyzes the responses, identifies the causes of dissatisfaction, makes changes, and checks the results.
ServicePulse from Stream Telecom helps you build surveys, automate CSAT, NPS, and CES calculations, and bring your results together in one workspace. Submit a request to get connected and launch your first survey to find out what your customers really think.